
Know your peak before it hits.
Connect live grid data and AutoML returns demand curves, risk, and plain-English answers. No data science team required.
24-hour load forecast
Peak load
812MW
P95 861 MW
Risk score
0.74
of 1.00
Cost impact
$184K
demand-charge exposure
Action window
15:30-17:15
before peak
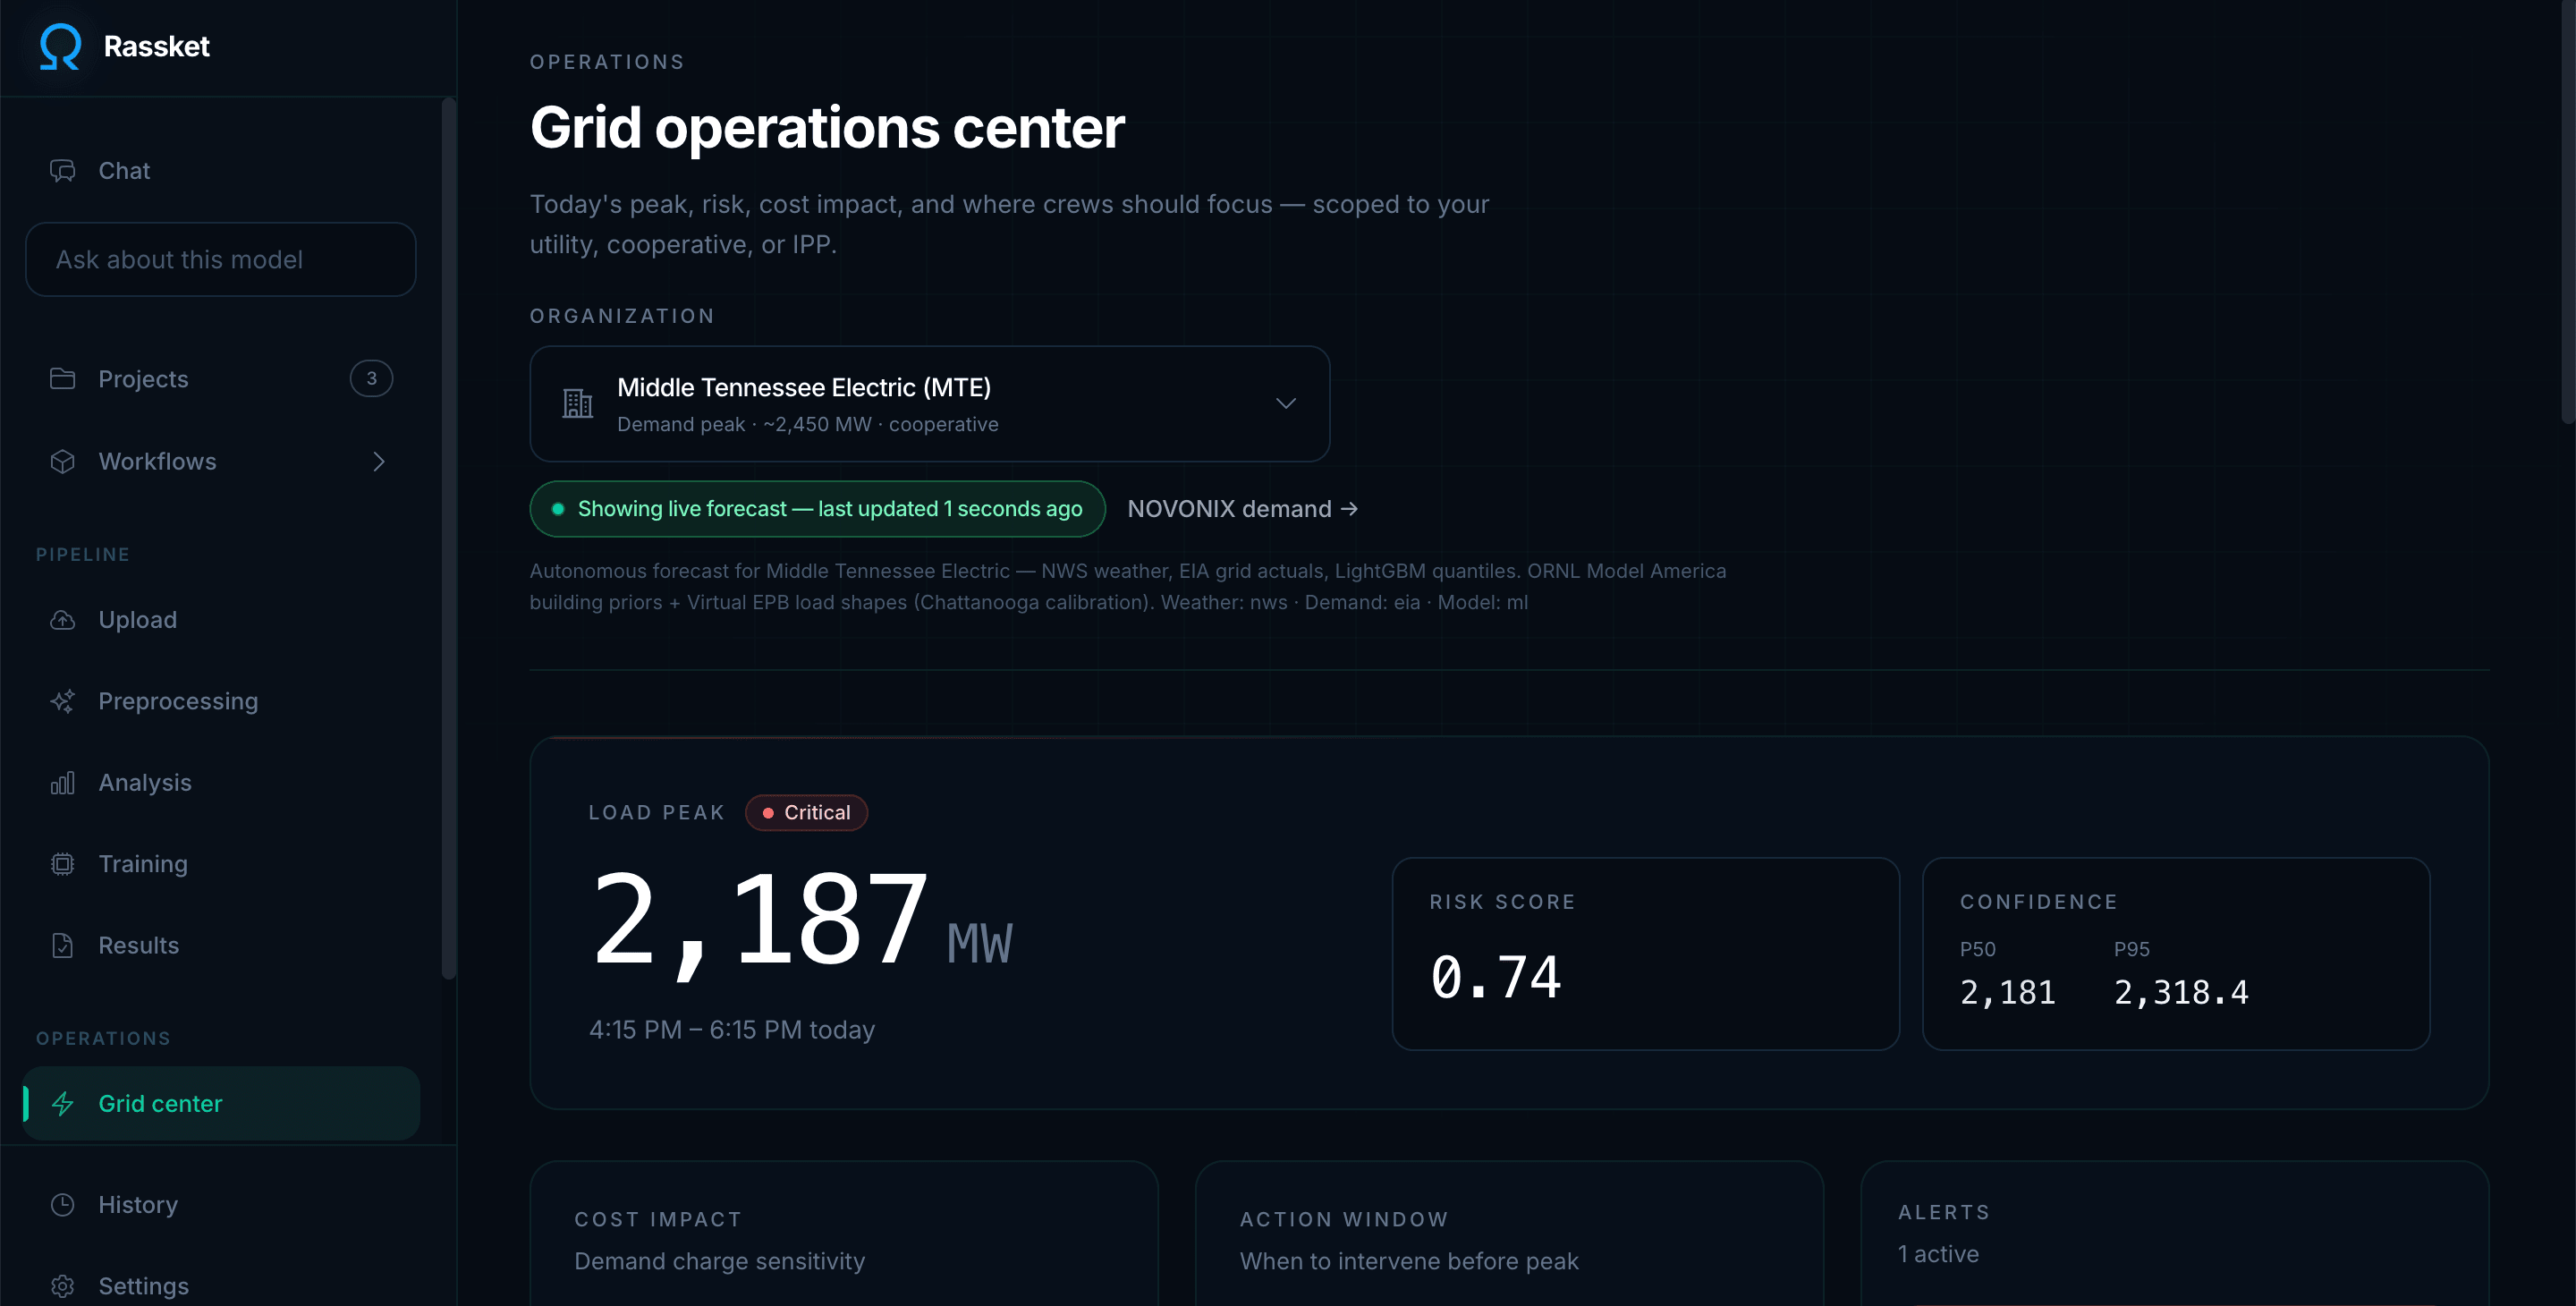
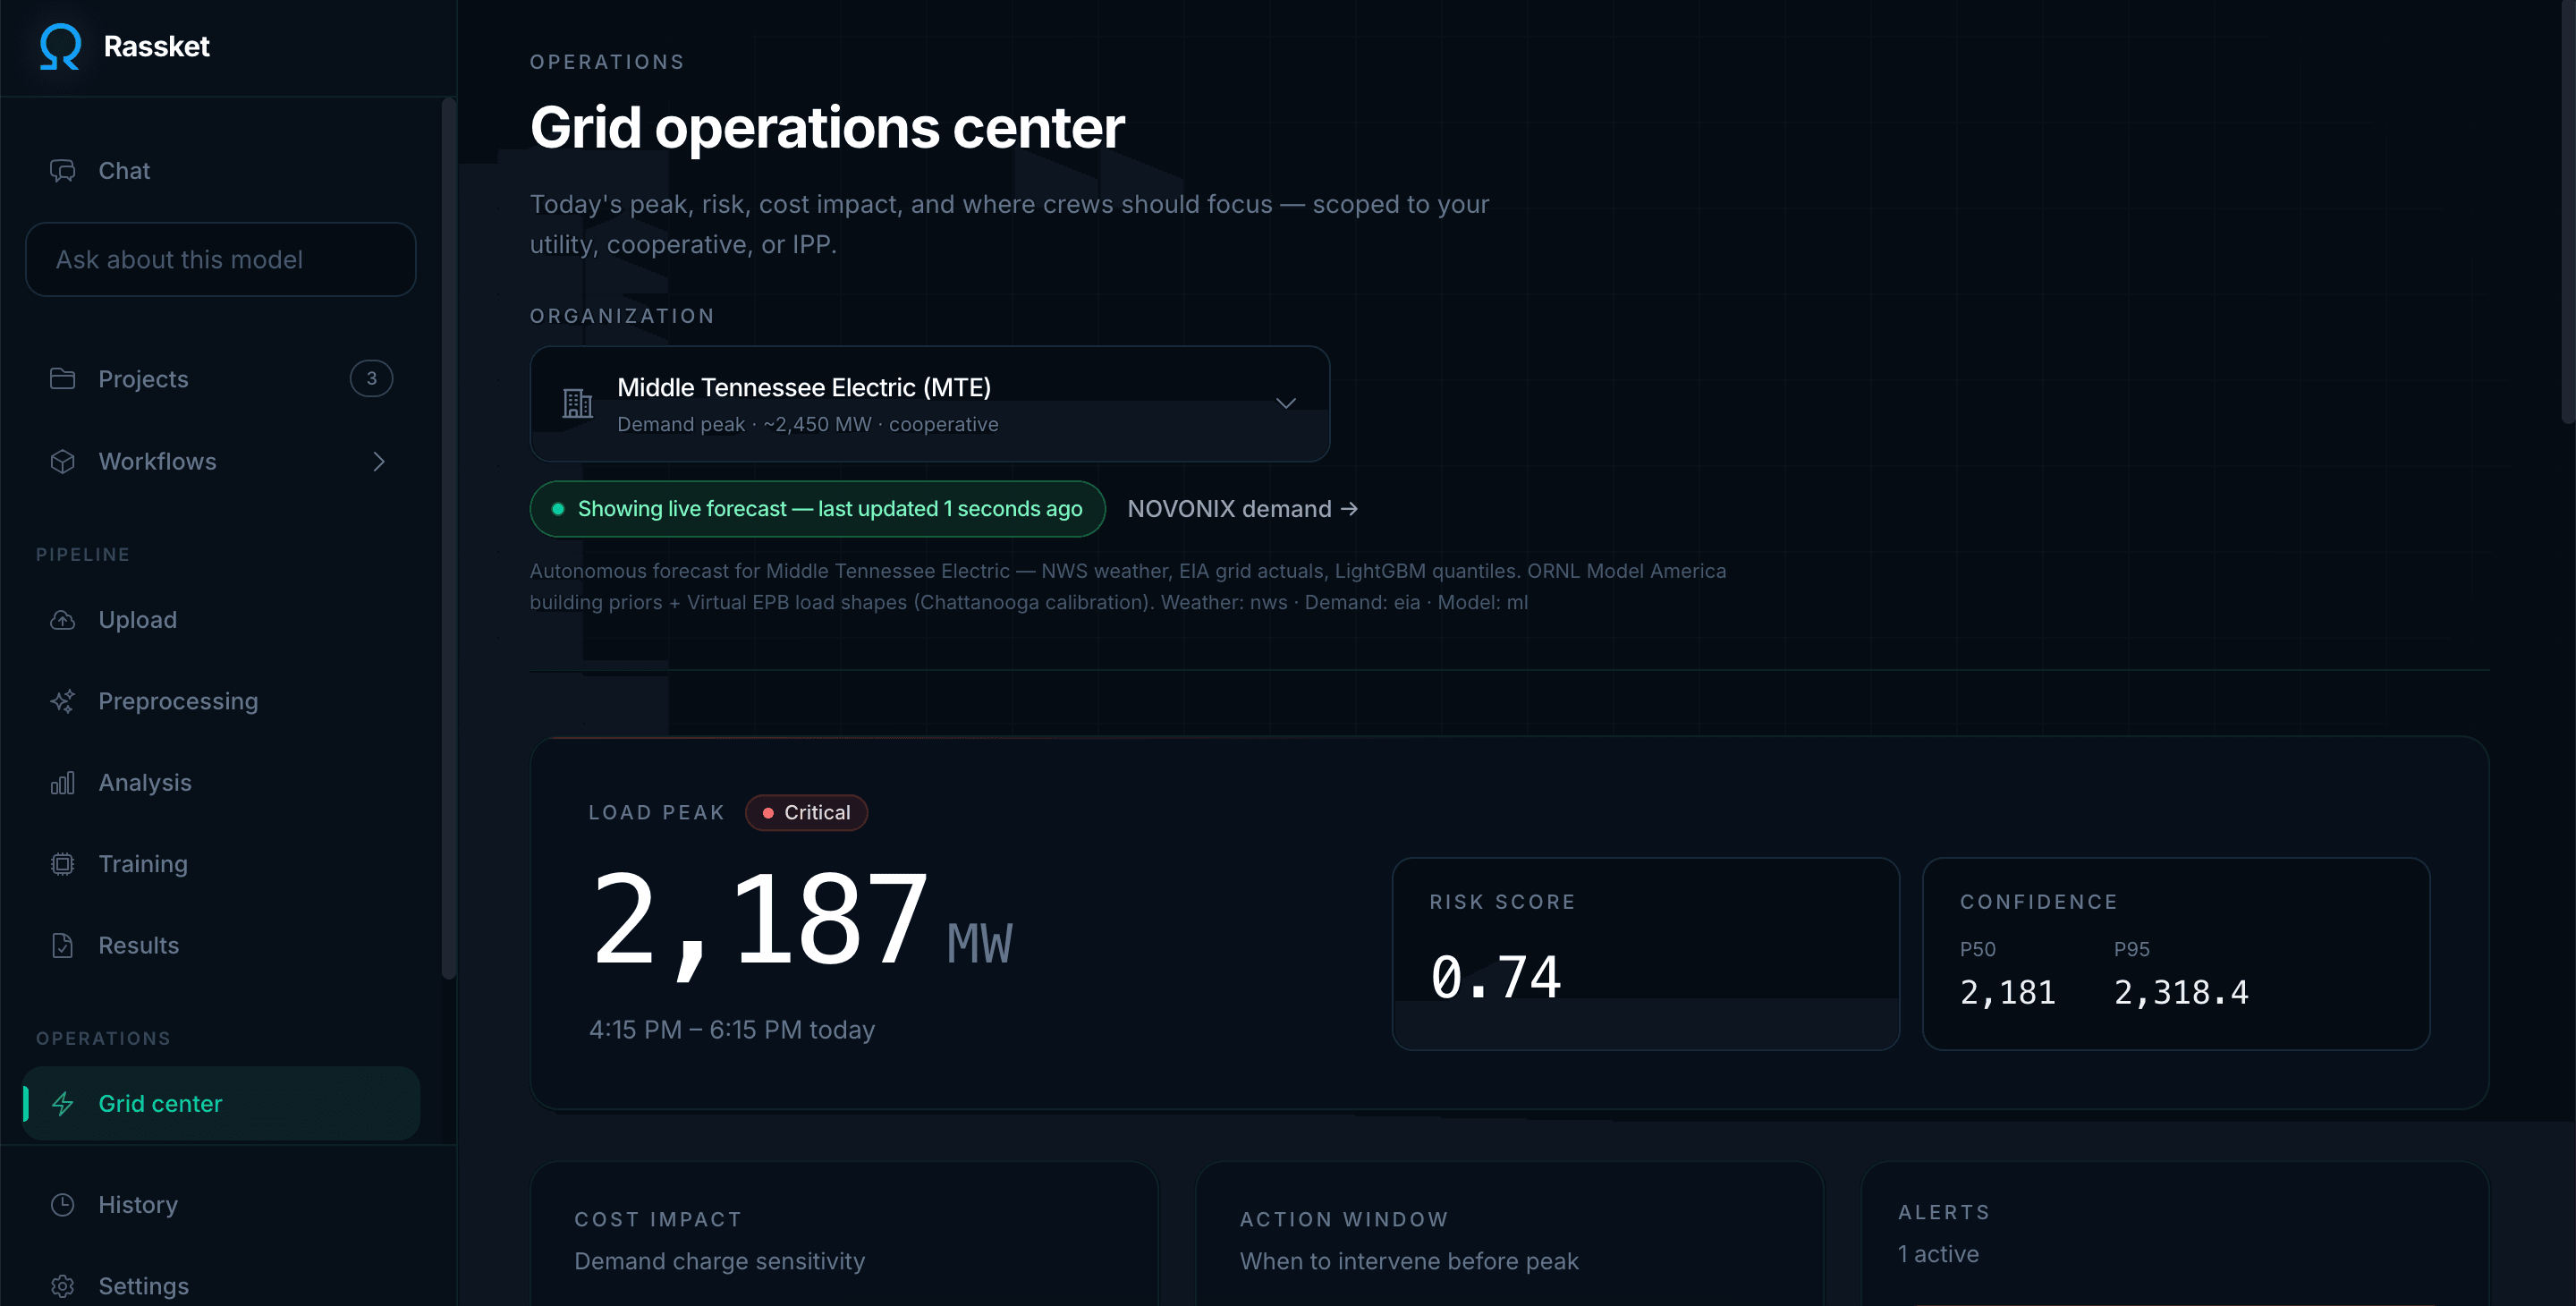
Point Rassket at your data and it returns a forecast your control room can act on: peak, risk, cost, and the window to intervene.
Built for forecasting teams at utilities, independent power producers, traders and large industrial operators.
- forecast accuracy on a 12-month grid dataset
- 94.2%
- forecast accuracy on a 12-month grid dataset
- from raw data to a production-ready forecast
- <1hr
- from raw data to a production-ready forecast
- less time spent on manual modeling
- 80%
- less time spent on manual modeling
- data scientists required to ship
- Zero
- data scientists required to ship
Every signal in. Every decision out.
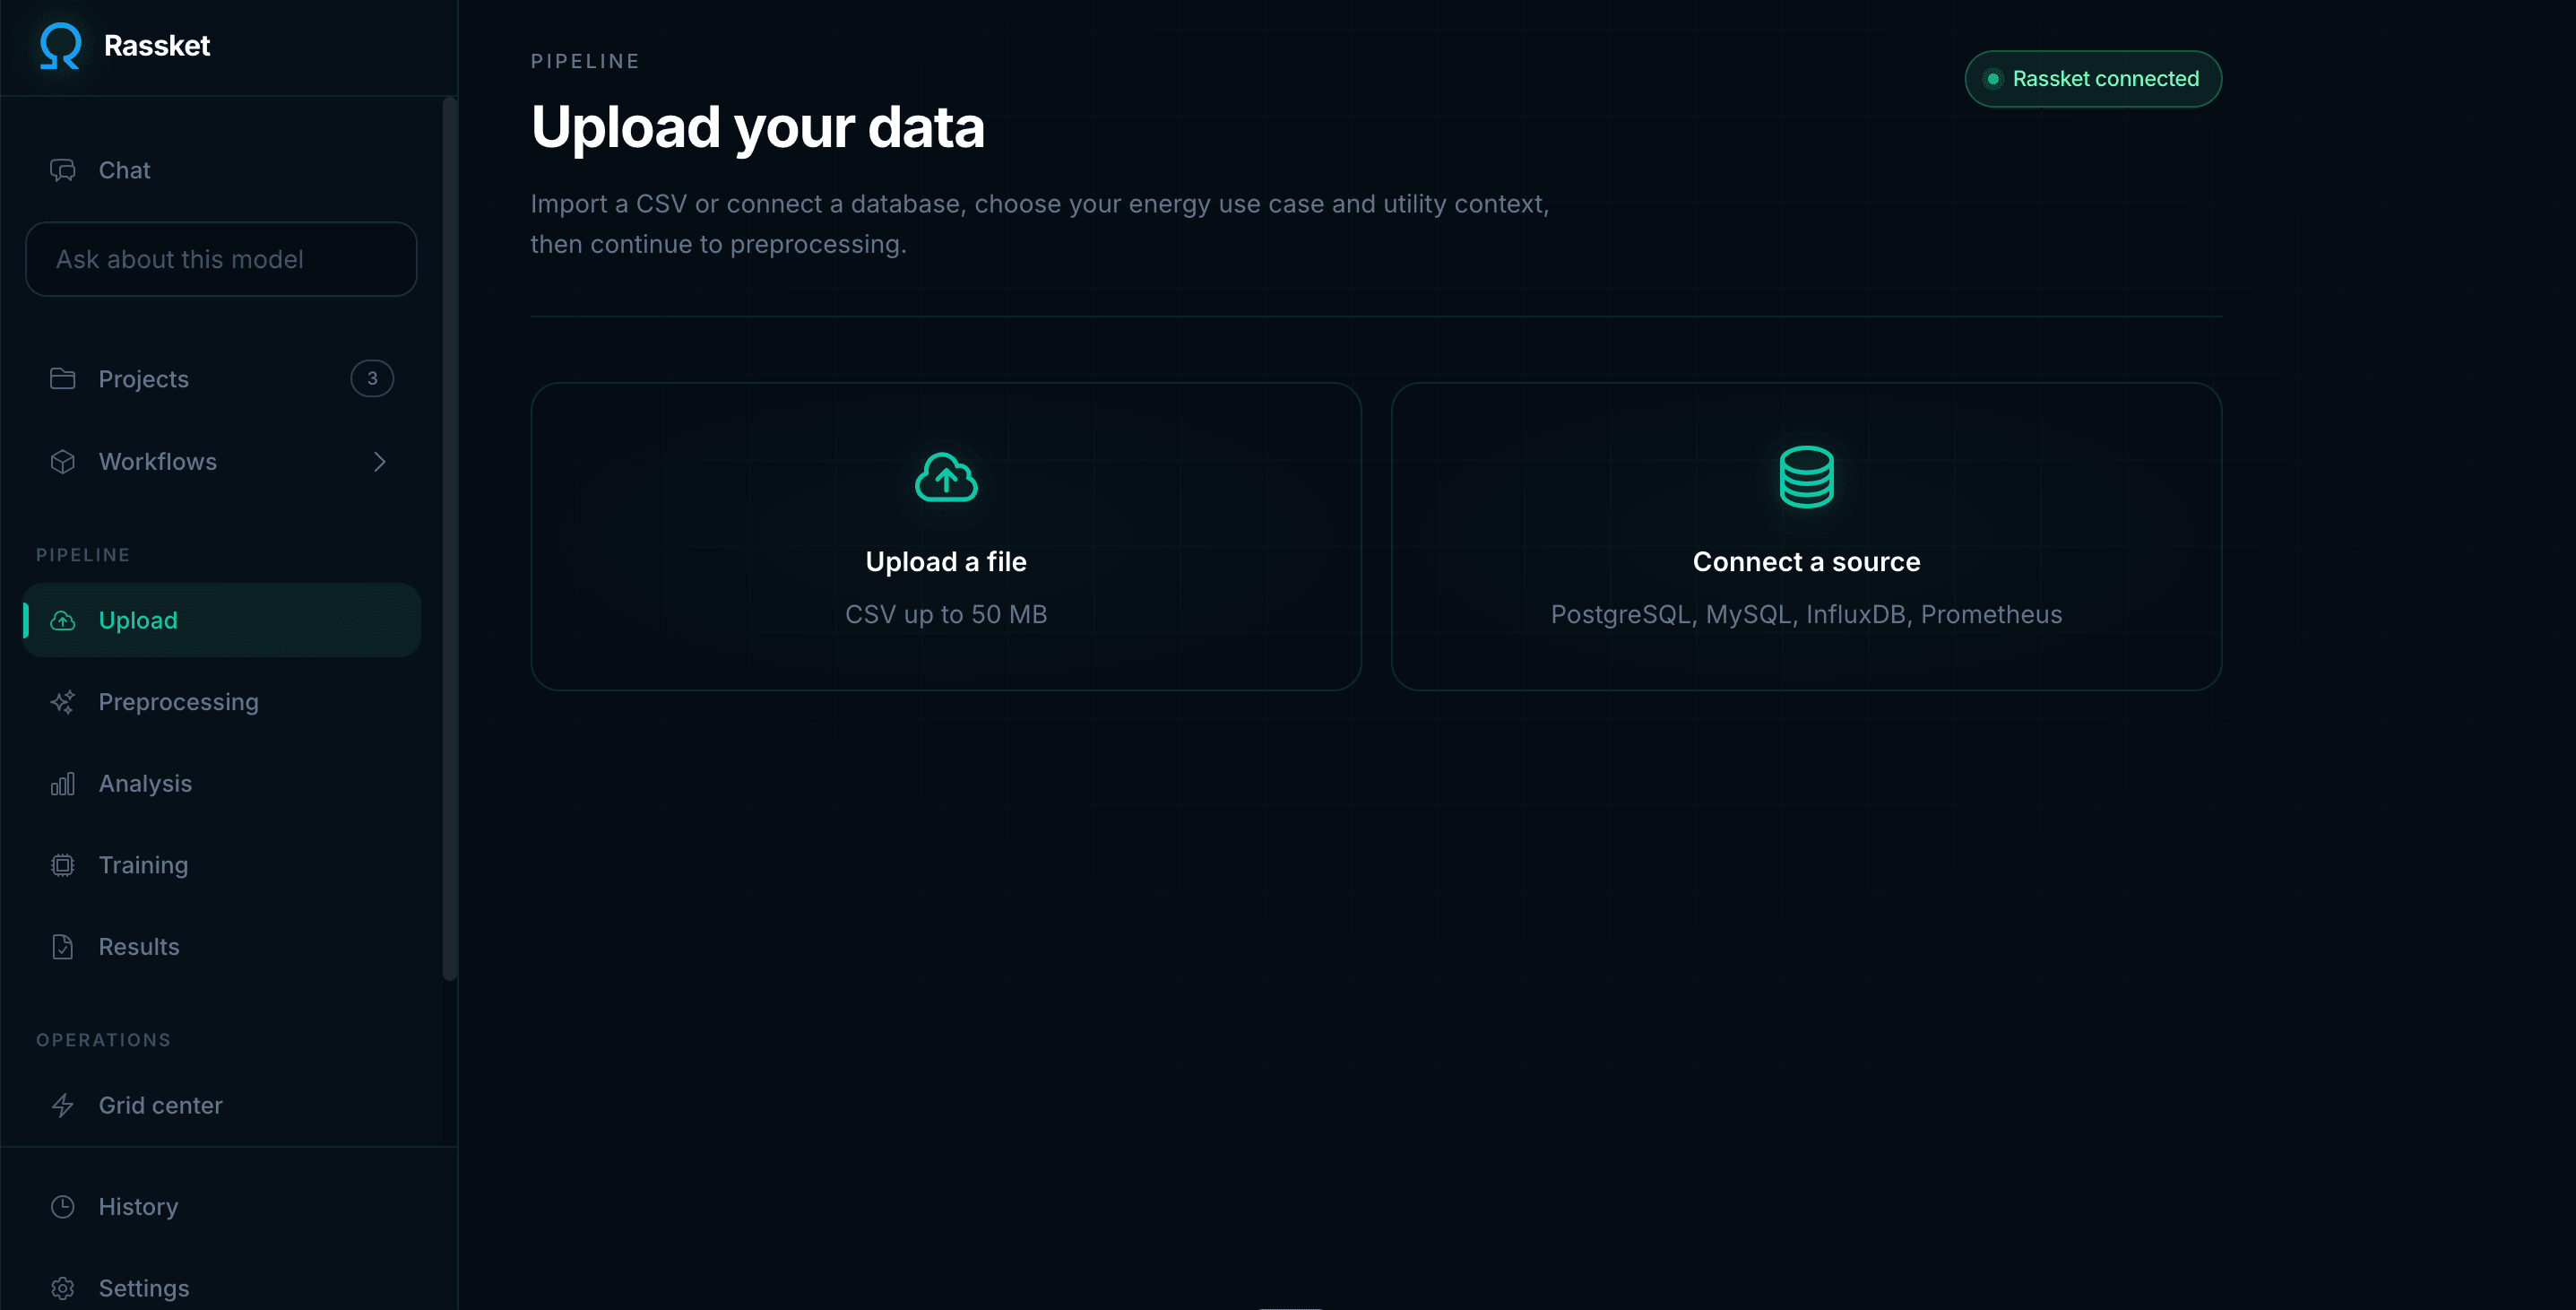
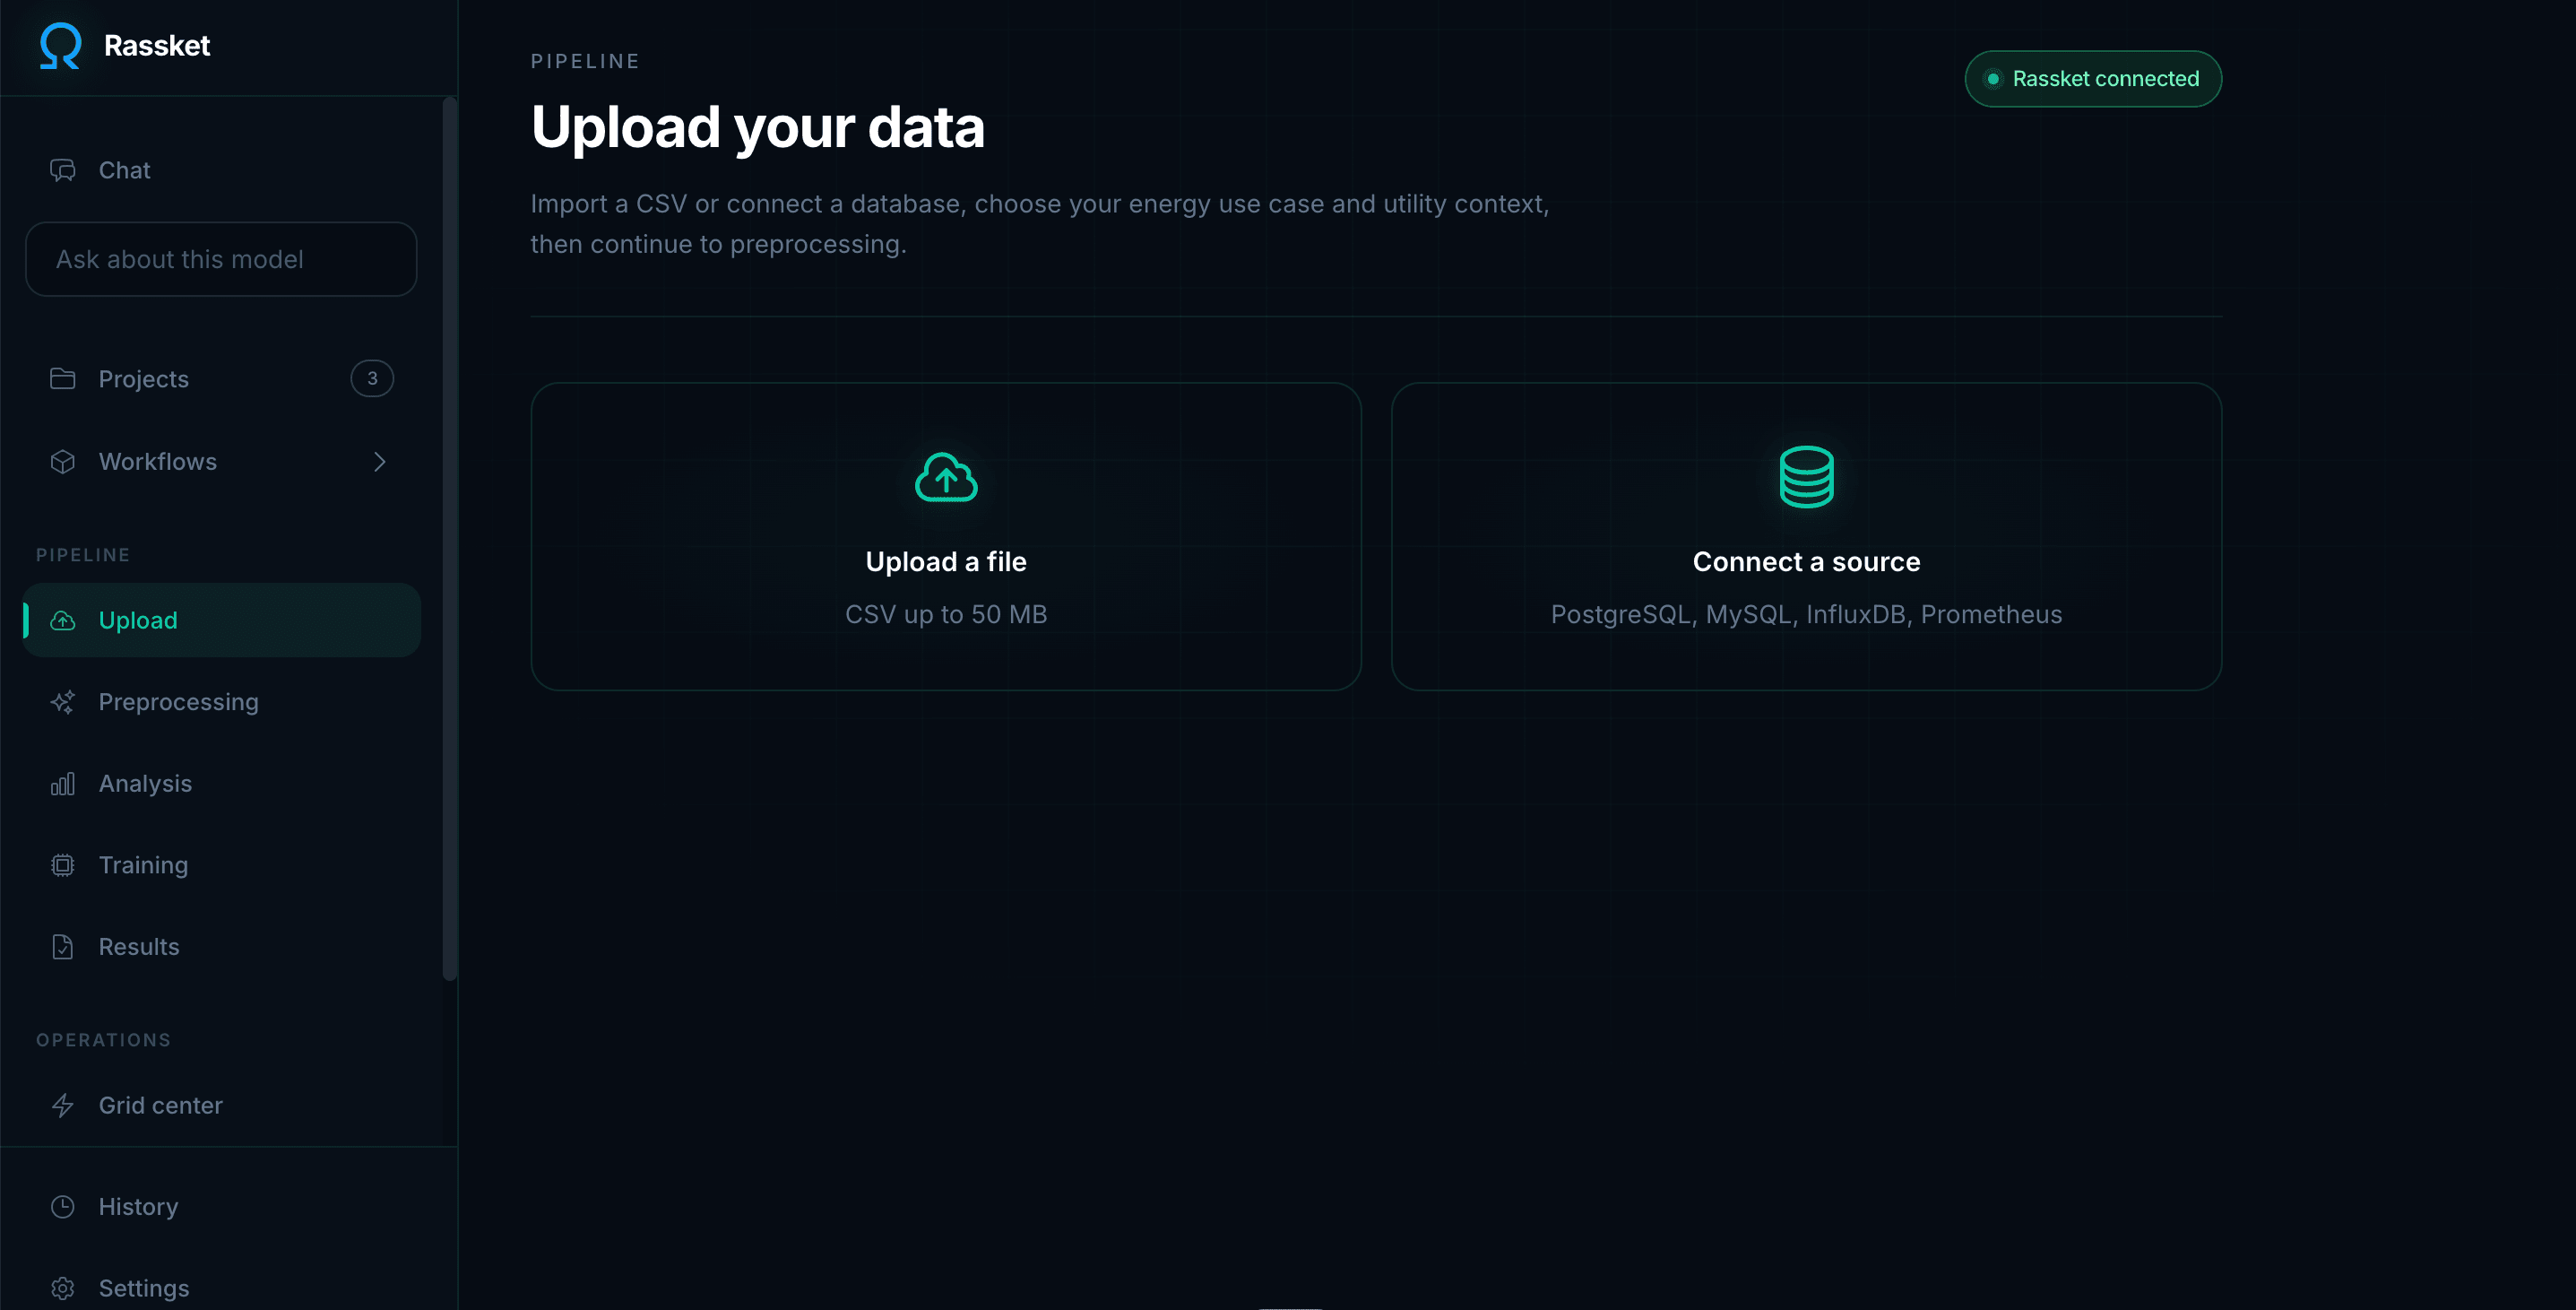
Connect live data from across your operation, let AutoML do the modeling, and get forecasts, insights, and answers your team can act on.
Grid and operations
- SCADA
- AMI meters
- Sensors
- Historians
Databases
 PostgreSQL
 MySQL
MySQL InfluxDB
 MongoDB
 Prometheus
Market context
- Weather
- Tariffs
- Prices
- Calendars
Ingest
Connect and clean live data
Train
AutoML with time-aware validation
Forecast
Predict, explain and monitor
Demand forecasts
Demand curves with P50 and P95 bands.
Grid and risk insights
Peak, risk score, cost impact and the window to intervene.
Plain-English answers
Ask questions of your data. No SQL, no dashboards to build.
Drift and alerts
Rassket flags model drift and retrains the moment accuracy slips.
Pricing that scales with the value you capture
Start free in shadow mode. You pay once Rassket has proven measurable savings on your own data.
Pilot
Prove the value on your own data, risk-free.
then 10% of verified savings
- Up to 10 projects
- 25 model trainings a month
- AI insights and plain-English results
- PDF and CSV export
- Email support
Enterprise
RecommendedLive pipelines and real-time forecasting for production teams.
per year, billed annually
- Unlimited projects
- Live data connectors
- Real-time predictions and drift detection
- Team collaboration and sharing
- Priority support
Gain-share
For large deployments. We win when your forecasts do.
of verified cost reductions
- Everything in Enterprise
- Custom data integrations
- Dedicated live pipeline support
- Dedicated solutions engineer
- 90-day performance guarantee
Every plan includes encryption in transit and at rest. Your data is never shared or sold.

Your first forecast, on your data, in under an hour.
Connect a live source or upload a CSV. No credit card, no data science team.